
- Trading Strategies
RSI, MACD, and Bollinger Bands — Made Simple
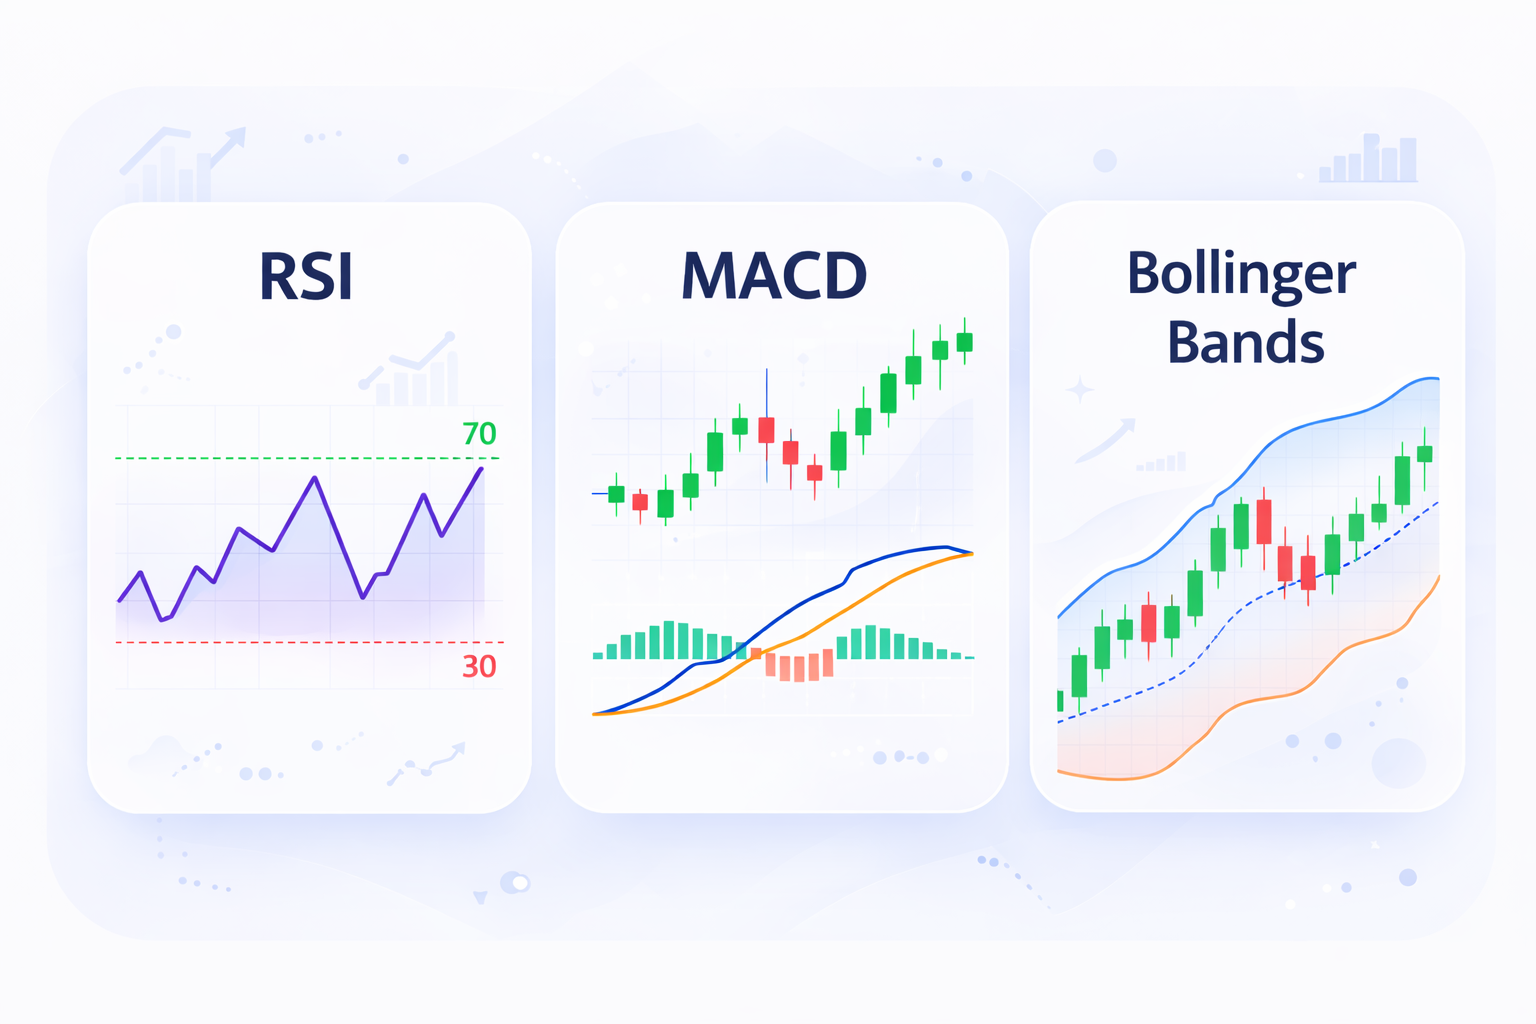
Table of contents
- Introduction
RSI — Reading Market Emotions
MACD — Spotting Trend Changes Early
Bollinger Bands — Measuring Market Volatility
How They Work Together
Using Tools Like Akinda.io
Conclusion
Introduction
If you’ve ever looked at a trading chart full of lines, colors, and candles, you’ve probably seen names like RSI, MACD, or Bollinger Bands. At first glance, they can seem confusing — but in reality, they’re just tools to help you understand what’s happening in the market.
Think of these indicators as your trading assistants. They don’t predict the future, but they give you clues about what might be coming next — whether prices are likely to rise, fall, or stay flat. Let’s break them down one by one, in simple terms.
RSI — Reading Market Emotions
The Relative Strength Index (RSI) is a powerful tool that helps traders understand the emotional state of the market. It measures the speed and change of price movements, giving you clues about whether an asset is overbought or oversold.
RSI values range from 0 to 100:
- When RSI is above 70, it suggests the asset may be overbought — meaning many traders have already bought in, and a price drop could be near.
- When RSI is below 30, it indicates the asset may be oversold — meaning it’s been heavily sold, and a rebound might be coming.
Imagine a rubber band: the more you stretch it, the more likely it is to snap back. RSI works similarly — it helps you spot when prices are stretched too far in one direction.
Visual Example (Conceptual):
The blue line shows RSI values day by day.
The red dashed line at 70 marks the overbought threshold; the area above is shaded red.
The green dashed line at 30 marks the oversold threshold; the area below is shaded green.
When the RSI crosses above 70, it enters the overbought (red) zone—often a signal that a reversal or pullback could happen.
When the RSI dips below 30, it enters the oversold (green) zone—often a signal that a bounce or upward reversal could be near.

RSI doesn’t work alone — it’s most effective when combined with other indicators like MACD or Bollinger Bands. But even on its own, RSI gives you a quick snapshot of market sentiment and possible turning points.
MACD — Spotting Trend Changes Early
The Moving Average Convergence Divergence (MACD) is a powerful indicator used to detect trend changes and momentum shifts in price movements. Though the name sounds technical, the concept is simple: MACD compares two moving averages to show whether a trend is gaining or losing strength.
MACD consists of two lines:
- MACD line: the difference between the 12-day and 26-day exponential moving averages (EMAs).
- Signal line: a 9-day EMA of the MACD line.
When the MACD line crosses above the signal line, it often signals a potential buy opportunity — suggesting upward momentum. When it crosses below, it may indicate a sell signal — pointing to downward momentum.
📊 Visual Example:
Below is a chart showing MACD and signal line crossovers. Green arrows mark buy signals, and red arrows mark sell signals. These crossover points help traders anticipate trend reversals before they fully develop.

MACD is especially useful in trending markets. It helps you avoid entering too late and gives early warnings when trends may be weakening. However, it’s not perfect — false signals can occur, especially in sideways markets.
For best results, combine MACD with other indicators like RSI or Bollinger Bands. Together, they provide a fuller picture of market behavior and help you make more confident decision
Bollinger Bands — Measuring Market Volatility
Bollinger Bands are a popular technical indicator that helps traders understand how volatile the market is. They consist of three lines:
- A moving average (usually 20-day)
- An upper band (moving average + 2 standard deviations)
- A lower band (moving average – 2 standard deviations)
These bands create a dynamic “tunnel” around price movements. When the bands widen, it means volatility is increasing — prices are moving more aggressively. When the bands tighten, it signals a calm market, often just before a breakout.
📊 Visual Example:
Below is a chart showing Bollinger Bands around a simulated price series.
- The gray shaded area represents the space between the upper and lower bands.
- Orange arrows show periods of widening — high volatility.
- Purple arrows show tightening — low volatility.

If the price touches the upper band, it may be overbought. If it hits the lower band, it could be oversold. But don’t rely on bands alone — they work best when combined with indicators like RSI or MACD.
Bollinger Bands are especially useful for spotting breakouts. When the bands tighten and price starts to move sharply, it often signals the beginning of a new trend.
In short, Bollinger Bands help you visualize market pressure — whether it’s building up or releasing — and prepare for potential price shifts.
How They Work Together
Each technical indicator — RSI, MACD, and Bollinger Bands — provides a unique perspective on market behavior. But when used together, they form a powerful toolkit that helps traders make more informed decisions.
- RSI measures market emotion — whether an asset is overbought or oversold.
- MACD tracks momentum and trend direction — showing when a shift may be starting.
- Bollinger Bands visualize volatility — helping you spot calm periods before big moves.
Let’s say RSI is below 30 (oversold), MACD shows a bullish crossover (MACD line crosses above the signal line), and Bollinger Bands are tightening. This combination suggests that the asset is undervalued, momentum is shifting upward, and a breakout may be near. That’s a strong buy signal.
On the flip side, if RSI is above 70 (overbought), MACD shows a bearish crossover, and Bollinger Bands are widening, it may indicate a potential sell signal — the asset is overvalued, momentum is weakening, and volatility is rising.
📊 Practical Tip:
Use these indicators together to confirm signals. One indicator alone might give a false alert, but when all three align, your confidence in the trade increases.
Remember, no tool is perfect. Always combine technical analysis with proper risk management, and never rely solely on indicators — they’re guides, not guarantees.
Using Tools Like Akinda.io
Learning to use technical indicators like RSI, MACD, and Bollinger Bands can be challenging at first — especially if you’re new to trading. That’s where platforms like Akinda.io come in. Designed with beginners in mind, Akinda.io simplifies complex analysis by offering intuitive tools, visual charts, and AI-powered insights.
Instead of manually calculating indicators or switching between multiple apps, Akinda.io lets you view everything in one place. You can track RSI levels, monitor MACD crossovers, and observe Bollinger Band movements — all with real-time data and interactive visuals. This helps you understand how indicators behave in different market conditions.
One of the platform’s strengths is its educational guidance. It doesn’t just show you the numbers — it explains what they mean. For example, if RSI drops below 30, Akinda.io might highlight it as a potential oversold signal and suggest caution or opportunity, depending on other factors.
It also offers backtesting tools, allowing you to test strategies using historical data. You can see how RSI, MACD, and Bollinger Bands worked together in past market scenarios — helping you build confidence before trading live.
In short, Akinda.io acts like a smart assistant for traders. It bridges the gap between theory and practice, making technical analysis more accessible, visual, and actionable — especially for those just starting out.
Conclusion
Technical indicators like RSI, MACD, and Bollinger Bands may seem intimidating at first, but once you understand what they measure — emotion, momentum, and volatility — they become powerful allies in your trading journey. These tools don’t predict the future, but they help you read the market’s behavior and make smarter, more informed decisions.
When used together, they offer a well-rounded view of price action. RSI tells you when the market is stretched emotionally, MACD shows when trends are gaining or losing strength, and Bollinger Bands reveal when volatility is building or fading. Recognizing when all three indicators align can give you high-confidence signals — but only if you combine them with discipline and proper risk management.
Platforms like Akinda.io make this learning curve easier. With visual charts, real-time data, and educational support, you can practice using these indicators without feeling overwhelmed. It’s a great way to turn theory into action and build your confidence step by step. Explore Akinda AI to generate interpretation of any historical charts.
📌 Final Tip: Start small. Choose one indicator, study it, test it, and then layer in others. Over time, you’ll develop your own strategy — one that’s based on understanding, not guesswork.
In trading, knowledge is your edge. And with the right tools, you’re already one step ahead.
Frequently Asked Questions (FAQ)
What does RSI actually measure?
RSI measures the speed and strength of recent price movements to show whether a market may be overbought or oversold.
Is RSI alone enough to trade?
No. RSI should be used as a confirmation tool alongside trend and volatility indicators like MACD and Bollinger Bands.
What does a MACD crossover mean?
A MACD crossover occurs when the MACD line crosses the signal line, suggesting a potential change in trend momentum.
Are Bollinger Bands buy or sell signals?
Not by themselves. Bollinger Bands show volatility, not direction. Price touching a band requires confirmation from other indicators.
Which indicator is best for beginners?
RSI and Moving Averages are usually easiest for beginners to understand and apply.
Can indicators predict the market?
No. Indicators analyze past data and help estimate probabilities — they do not guarantee future outcomes.
How many indicators should I use together?
Most traders use 2–3 indicators. Using too many can cause confusion and conflicting signals.
This article is for educational purposes and reflects widely accepted principles in finance and investment analysis.
Sources & Further Reading
- Murphy, J. J. (1999). Technical Analysis of the Financial Markets. New York Institute of Finance.
- Pring, M. J. (2014). Technical Analysis Explained. McGraw-Hill Education.
- Bodie, Z., Kane, A., & Marcus, A. J. (2021). Investments. McGraw-Hill Education.
- Investopedia (2023). RSI, MACD, and Bollinger Bands Explained.
- Akinda.io (2025). Investor Education Resources.