
- Trading Strategies
Common Technical Indicators Explained Simply
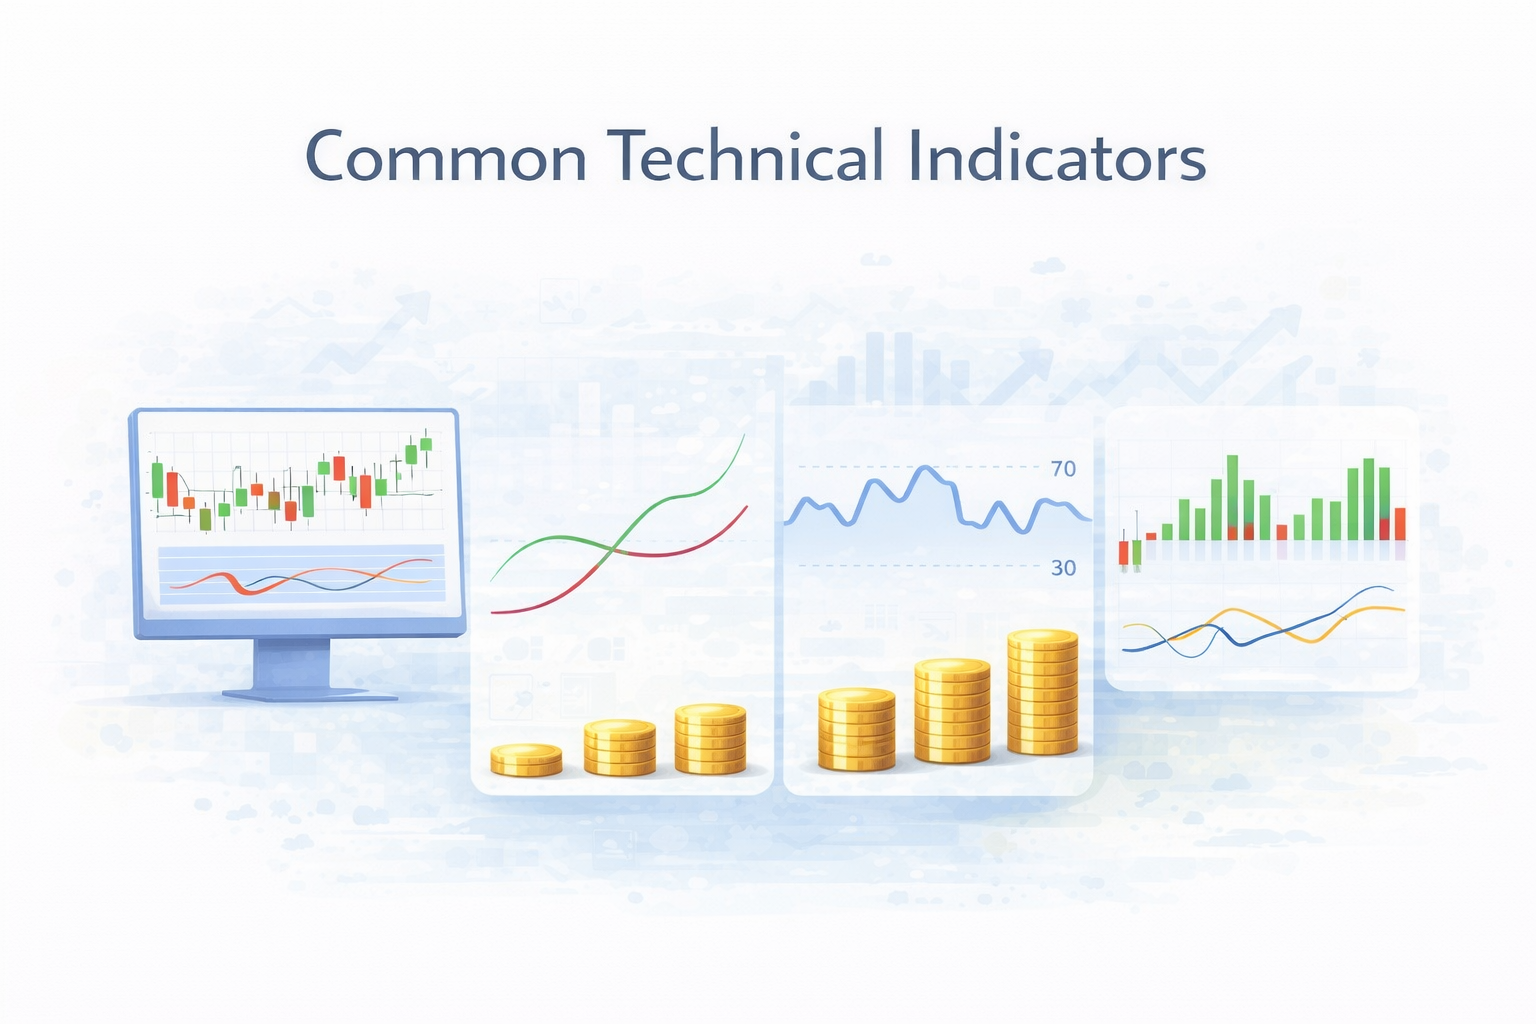
Table of contents
- Introduction
What Is an Indicator in Trading?
Trend Indicators
Momentum Indicators
Volatility Indicators
Volume Indicators
How to Use Indicators Wisely
Conclusion
Introduction
Technical indicators are numerical computations that use a stock's price, volume, or both. They assist traders in studying past market activity in an effort to predict some possible future price action. Indicators appear on a stock chart as lines, bands or oscillators, or perhaps a combination of the two, and show graphic data about market trends, market momentum, volatility, and/or volume activity.
What Is an Indicator in Trading?
In trading, technical indicators are tools derived from price and volume-of-trading data that are useful for analyzing past price-action behavior and predicting future price-action movement. They are displayed as either lines, bands, or oscillators on a price chart and are meant to measure trends, momentum, volatility, and/or volume, that give the trader insight into when to buy, sell or hold a stock.
Trend Indicators
Trend indicators are used to establish the general direction of the market. Moving averages smooth out price information, MACD measures the relationship between varying averages, and Parabolic SAR helps to identify trend reversals.
Moving Average (MA)
The most widely used technical analysis method is the Moving Average (MA). A moving average helps traders overcome daily price fluctuations by smoothing information to signal the direction of a stock. The easiest one, the Simple Moving Average (SMA), uses the closing price smoothed over a number of days, say 50 or 200. What the stock does near these averages is what traders will watch to see if the stock is moving up or down. There is also a more advanced form, the Exponential Moving Average (EMA), which puts more emphasis on more recent prices and therefore reacts more to more recent activity in the market. EMAs are particularly useful to short-term traders who would prefer to identify market movements earlier. A widely known example is the crossover method wherein the crossover of a short EMA over a long one signifies buying and selling prospects respectively.
MACD (Moving Average Convergence Divergence)
Another important indicator is the MACD (Moving Average Convergence Divergence), which measures trend and momentum. The MACD is built from the interaction between two EMAs, typically the 12-day and 26-day averages. The result is graphed as the MACD line and, in addition, a signal line, which is an EMA of 9 days of the MACD. When the MACD line crosses the signal line, the trend is bullish, but a reversal downward is thought to be evidence of bearish momentum. A histogram, graphing the difference between the two lines, demonstrates the strength of this momentum. MACD is used everywhere because it combines trend-following attributes with momentum research in order to give a jack-of-all-trades indicator to confirm price action.
Parabolic SAR (Stop and Reverse)
Parabolic SAR (Stop and Reverse) is another technical indicator that is designed to detect upcoming reversals of market direction. It is drawn on charts as a line of dots that trail behind the price. When the dots are below the price, the Parabolic SAR is showing an uptrend; when they show above, it is showing a downtrend. Traders also utilize the Parabolic SAR to determine points of exit in trend markets since the emergence of a dot on the other side of the price can be indicative that the ongoing trend is losing momentum. But in lateral markets where there is very little specific direction, the Parabolic SAR can give false signals, and thus it serves best as a complement to other indicators.
These three indicators combined form good building blocks to discuss market action. Moving Averages ascertain the overall direction, the MACD the momentum in the direction, and the Parabolic SAR the likely points of reversals. Combined, the traders can further estimate when to initiate a trade, confirm the vigor of a trend, and be informed when to close.
Momentum Indicators
Momentum gauges estimate the power of price movements. The Relative Strength Index (RSI) indicates when a stock is overbought at more than 70 or oversold at less than 30, tending to signal reversals. The Stochastic Oscillator measures closing prices versus recent ranges and readings above 80 as overbought and below 20 as oversold. The Rate of Change (ROC) measures percentage change in price over time, indicating whether momentum is accelerating or decelerating.
Volatility Indicators
Volatility indicators reflect the extent of price movement. Bollinger Bands surround a moving average with bands that widen in times of volatility and narrow in times of calm, reflecting potential overbought or oversold levels. Average True Range (ATR) calculates average price travel to gauge market volatility, useful in setting stop-loss levels. Keltner Channels, based on ATR, provide smoother channel trends and help affirm breakouts or reversals.
Volume Indicators
Volume reflects the strength behind price action. On-Balance Volume (OBV) calculates cumulative buying and selling pressure. VWAP (Volume Weighted Average Price) is a point in the average price by volume of the day and can be applied as a benchmark for bullish or bearish conditions. Chaikin Money Flow (CMF) employs both price and volume to measure whether money is going in or out of a stock.
How to Use Indicators Wisely
Technical indicators are effective instruments, although certainly not fool-proof. One of the more consistent blunders traders make is to rely on a single indicator for their decision-making. This typically produces false signals, especially in unpredictable and sideways markets. A better idea, however, is to layer indicators based on different roles—trend indicators to identify follow the direction of price, momentum to assess the strength of it, and volume indicators to confirm participation in price moves. Layering the perspective of multiple indicators helps a trader filter noise and isolate the most significant signals.
It is also salient to keep in mind that indicators work better as confirmation tools rather than for primary decision-making. For example, if the price action and charts suggest an uptrend, the indicators can confirm whether the uptrend is valid by confirming momentum and volume in the uptrending movement. Even more so than signals, indicators can prove helpful for risk management. An indicator of Volatility such as the Average True Range (ATR), can help traders setup their Stop-Loss orders, and an indicator based on volume can tell a trader whether to identify sufficiently strong breakouts.
Indicators should always be utilized in a larger plan that incorporates strategy, discipline, and clear risk controls. While indicators can enhance the decision-making process in trading, they will not take away the uncertainty. For a trader who is guided by indicators, rather than guaranteed.
Conclusion
Technical indicators are more than mathematical equations; they convey how human behavior and market psychology are embodied in price action. By examining how they work and what they are inferring, traders gain a clearer understanding of market structure(s), the sentiment of the crowd, and possible turning points. Their true worth lies not in remembering calculations, but in knowing what indicators are suggesting about the market’s narrative. Successful traders understand that indicators are most strong as tools when used with experience, context, and disciplinary state of mind. No one chart pattern or calculation can forecast what's going to happen, but when indicators are used in a thoughtful manner within a planned trading structure, then the indicators become a compass to help traders navigate, during times of uncertainty, the market with increased confidence. Explore Akinda AI to generate interpretation of any historical charts.
Frequently Asked Questions (FAQ)
What are technical indicators in simple terms?
Technical indicators are tools that use price and volume data to help traders understand market trends, momentum, and potential reversals.
Are technical indicators reliable for beginners?
Yes, but only when used correctly. Beginners should use indicators as confirmation tools, not as automatic buy or sell signals.
Which indicator is best for beginners?
Moving Averages and RSI are often the easiest to understand and apply for beginners.
How many indicators should I use at once?
Usually 2–3 indicators are enough. Too many indicators can cause confusion and conflicting signals.
Can indicators predict the market?
No. Indicators analyze past data. They help assess probability, not predict outcomes with certainty.
Do indicators work in all market conditions?
No. Trend indicators work best in trending markets, while momentum and volatility indicators may perform better in ranging or volatile markets.
Should indicators be used alone?
No. Indicators should always be combined with price action, risk management, and a clear trading plan.
How can Akinda.io help with indicators?
Akinda.io helps traders visualize multiple indicators together, analyze risk levels, and apply structured decision-making instead of emotional trading.
This article is for educational purposes and reflects widely accepted principles in finance and investment analysis.