
- Stock Market & Equities
How to Read a Stock Chart for Beginners
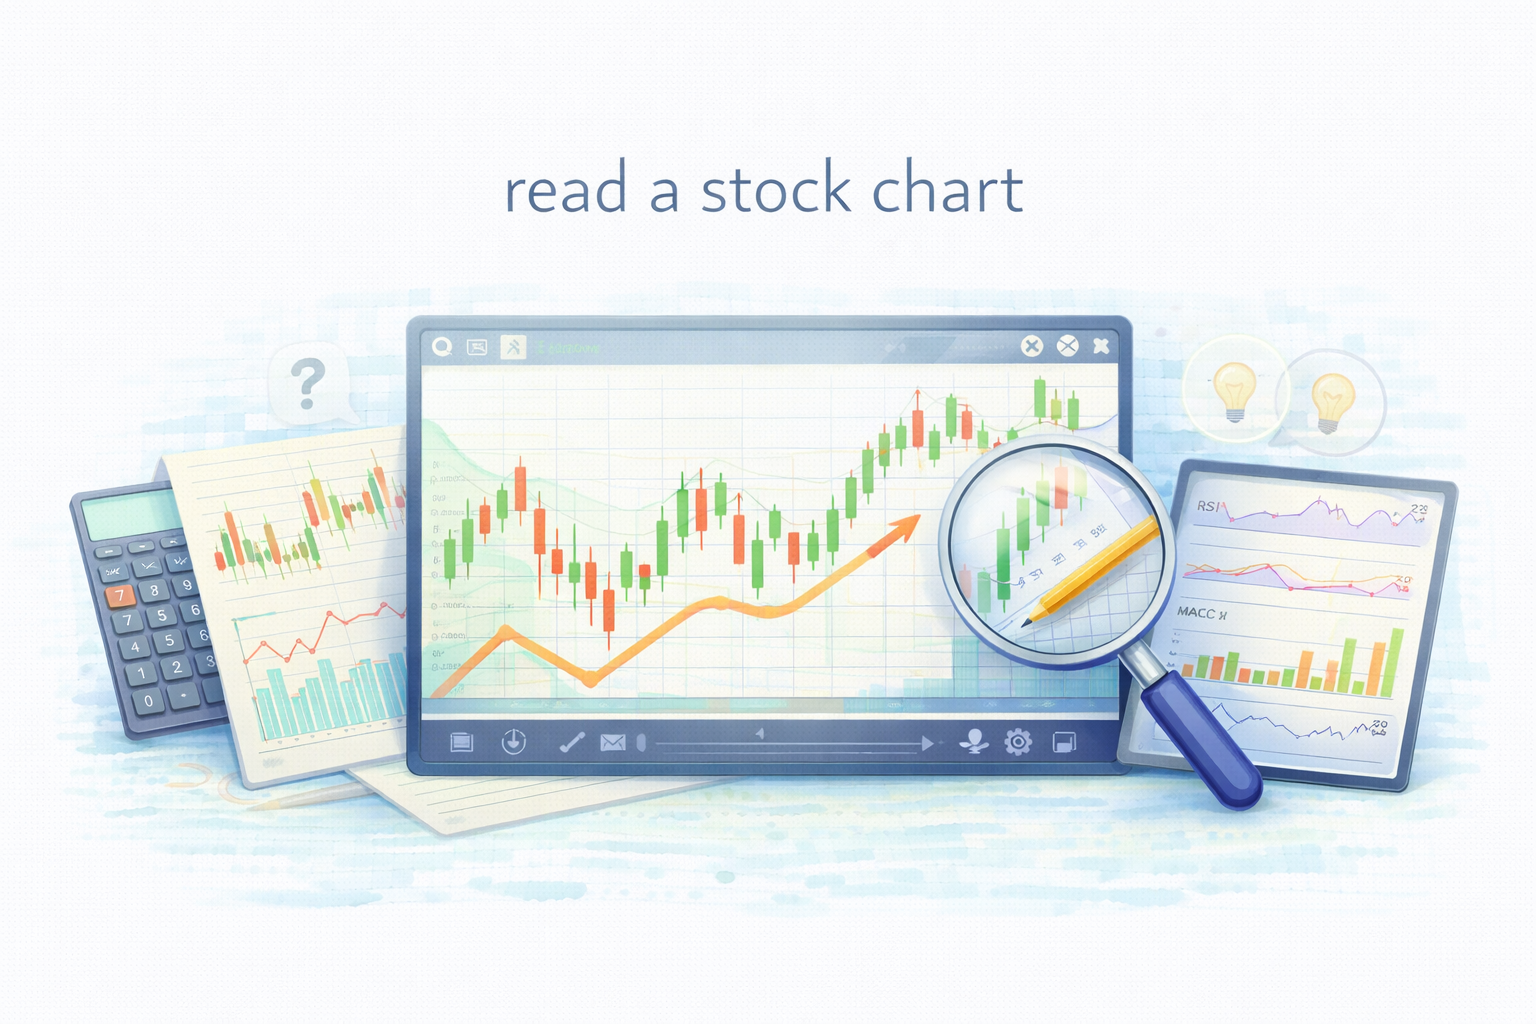
How to Read Stock Charts: A Beginner’s Guide
Table of contents:
- Introduction
What Is a Stock Chart?
Key Elements of a Stock Chart
Common Types of Stock Charts Explained
How to Identify Stock Market Trends
Moving Averages and Technical Indicators
Support and Resistance Levels Explained
Why Reading Stock Charts Matters
Common Stock Chart Mistakes Beginners Make
Conclusion
Introduction
Understanding how to read a stock chart is a fundamental skill for anyone interested in investing or finance. A stock chart visually presents how a company’s share price changes over time, helping investors make informed decisions about when to buy, hold, or sell. For many beginners, stock charts may initially appear complicated with various lines, bars, and colors. However, once you understand their basic components, they become one of the most powerful tools for understanding market behavior.
In today’s fast-paced digital age, platforms such as akinda.io make it easier than ever to access real-time stock data, visualize trends, and perform both technical and fundamental analysis — all in one place.
What Is a Stock Chart?
A stock chart is a graphical representation of a stock’s price movements over a specific period — such as a day, week, month, or year. It shows how the market values a company over time, revealing both short-term fluctuations and long-term trends.
Most financial websites, stock exchanges, and brokerage platforms — including interactive analysis tools — offer stock charts with real-time updates. These charts typically display information such as:
–Opening and closing prices
–Highs and lows
–Trading volume
– Indicators like moving averages or momentum oscillators
Together, these details allow investors to understand not only what happened to a stock’s price but also why it happened — reflecting investor sentiment, company performance, and market conditions.
Key Elements of a Stock Chart
1. Price and Time Axes
The vertical (Y) axis represents the stock’s price, while the horizontal (X) axis represents time. Reading from left to right, investors can observe how a stock’s price has evolved across different time frames — whether minutes, days, or years.
2. Opening, Closing, High, and Low Prices
Each trading session includes four key price points:
Opening price – the first trade of the day.
Closing price – the final trade before the market closes.
High and low prices – the maximum and minimum levels reached during that period.
These figures help investors assess volatility, which shows how much a stock’s price changes within a given timeframe.
3. Trading Volume
The trading volume is displayed as bars below the price chart and indicates how many shares were traded during that period. High trading volume usually means strong investor interest, possibly due to major news or earnings reports. Low volume might signal indecision or lack of enthusiasm. Understanding volume helps investors confirm whether a price move is strong and sustainable or merely a temporary fluctuation.
Common Types of Stock Charts Explained
Line Chart: This is the simplest type of stock chart, connecting daily closing prices with a continuous line. It’s ideal for beginners who want to see overall trends but doesn’t show daily price fluctuations in detail.
Bar Chart: Each bar represents a specific period (such as a day, week, or month) and includes the opening, high, low, and closing prices. This type of chart provides a clearer view of volatility and market sentiment.
Candlestick Chart: The most popular format among investors, the candlestick chart shows the same information as a bar chart but in a more visual and colorful way.
A green (or white) candle indicates the closing price was higher than the opening price — showing a gain.
A red (or black) candle indicates the closing price was lower — showing a loss.
Candlestick charts help investors quickly interpret whether buyers or sellers dominate the market and can be used to spot short-term trading signals.

Source: Marketfeed.
How to Identify Stock Market Trends
One of the main purposes of reading stock charts is to recognize market trends, as they reveal the general direction in which a stock’s price is moving over time. Understanding trends is crucial because markets rarely move in a straight line — prices fluctuate daily, but the broader trend helps investors identify the stock’s overall trajectory and make strategic decisions about buying, holding, or selling.
A trend can be described as the long-term movement of prices in a particular direction. It reflects the balance between supply and demand in the market and is heavily influenced by investor psychology, company performance, and macroeconomic factors. Recognizing the type of trend allows investors to align their strategies with market momentum rather than against it.
1. Uptrend (Bullish Trend)
An uptrend occurs when a stock’s price forms a series of higher highs and higher lows over a specific period. This pattern indicates that buyers (bulls) are in control, consistently pushing prices higher.
Characteristics: Rising peaks and troughs, increasing investor confidence, and higher trading volumes.
Implications: Investors often view uptrends as signals to buy or hold positions, expecting continued growth.
Example: A company announcing strong quarterly earnings or new product developments may trigger an uptrend as optimism spreads among investors.
Tip: In technical analysis, moving averages such as the 50-day or 200-day lines can help confirm an uptrend — if the price remains consistently above these averages, it suggests sustained strength.
2. Downtrend (Bearish Trend)
A downtrend is the opposite, characterized by a series of lower highs and lower lows. It reflects weakening investor sentiment, often triggered by disappointing earnings, negative market news, or broader economic downturns.
Characteristics: Prices repeatedly fail to reach previous highs and continue setting new lows.
Implications: This pattern signals that sellers (bears) dominate the market. Investors may consider selling their holdings or avoiding new entries until signs of reversal appear.
Example: If a company faces declining profits or regulatory challenges, its stock may experience a prolonged downtrend as confidence erodes.
Tip: Technical indicators like the Moving Average Convergence Divergence (MACD) or Relative Strength Index (RSI) can help detect when a downtrend may be losing momentum and approaching a potential reversal point.
3. Sideways Trend (Consolidation or Range-Bound Market)
A sideways trend occurs when prices move within a narrow range without a clear upward or downward direction. This pattern suggests that neither buyers nor sellers have full control.
Characteristics: Stable highs and lows within a confined zone, typically forming horizontal support and resistance levels.
Implications: Sideways trends often appear after strong movements, serving as a period of consolidation before the next big price breakout.
Example: A stock might trade between $100 and $110 for several weeks as investors wait for new information to guide their next move.
Tip: Traders often prepare for breakouts during such phases — once the price moves decisively above resistance or below support, a new trend usually begins.
Recognizing trends helps investors avoid emotional decision-making and instead rely on data-driven insights. Entering trades in the direction of the dominant trend typically offers a higher probability of success than trading against it. For instance:
- Buying during an uptrend allows investors to benefit from continued price appreciation.
- Avoiding or short-selling during a downtrend can protect capital or generate profit from falling prices.
- Identifying sideways trends can help investors stay patient, waiting for clearer signals before taking action.
Modern analytical platforms, such as akinda.io, enhance trend identification by offering interactive visual tools that automatically plot trend lines, moving averages, and price channels. This helps users easily distinguish between short-term fluctuations and long-term patterns, enabling smarter, more confident investing decisions.
Ultimately, mastering trend analysis allows investors to “see the bigger picture” behind daily market noise — a vital step in developing disciplined and successful investment strategies.
Moving Averages and Technical Indicators
Many stock charts include technical indicators, which help smooth out price data and make patterns easier to spot.
The most common one is the Moving Average (MA) — the average stock price over a specific period (such as 50 or 200 days).
A rising MA suggests a positive, upward trend.
A falling MA may indicate weakening momentum.
Other helpful tools include:
RSI (Relative Strength Index): Measures price momentum and shows whether a stock may be overbought or oversold.
MACD (Moving Average Convergence Divergence): Highlights changes in momentum and helps identify potential trend reversals.
These indicators help investors confirm whether price movements reflect strong, lasting trends or just short-term fluctuations.
Support and Resistance Levels Explained
Support and resistance are key psychological zones that influence how a stock’s price moves.
Support: The price level where buying pressure is strong enough to prevent further declines.
Resistance: The price level where selling pressure tends to stop further rises.
Recognizing these levels helps investors anticipate potential turning points and plan their entry and exit strategies more effectively.
Why Reading Stock Charts Matters
Reading stock charts helps investors understand how the market values a company and how its price reacts to factors like economic news, earnings reports, or global events. It’s not about predicting the future with certainty, but about making informed, data-driven decisions rather than emotional ones.
Stock charts also reveal market psychology — showing how collective investor behavior influences price movements. Learning to interpret these patterns builds patience and discipline, both essential qualities for successful investing.
Common Stock Chart Mistakes Beginners Make
Even experienced investors can misread stock charts, especially when emotions or overconfidence take over. Here are some of the most frequent mistakes to watch out for:
1. Ignoring Trading Volume
Volume shows the strength behind a price move. A rise in price with high volume usually confirms genuine market interest, while low-volume increases may signal weak or temporary momentum. Ignoring this can lead to false conclusions about trend strength.
2. Focusing Only on Short-Term Changes
Watching daily price swings without considering the bigger picture often leads to poor decisions. Short-term fluctuations are normal and often caused by temporary news or investor emotion. Looking at longer-term trends provides a clearer view of a stock’s true direction.
3. Relying Only on Technical Analysis
Charts alone don’t tell the full story. Investors should also analyze company fundamentals such as earnings, industry position, and management quality. Combining both technical and fundamental analysis results in smarter, more balanced decisions.
4. Letting Emotions Influence Decisions
Fear and greed can make investors react impulsively — selling too soon during dips or chasing quick gains during rallies. Staying disciplined and following a clear plan helps avoid these emotional mistakes. With the help of Akinda AI you can interpret any chart.
Conclusion
Learning to read a stock chart empowers investors to interpret market behavior and make smarter financial decisions. By understanding key elements such as price trends, trading volume, moving averages, and support and resistance levels, beginners can gain confidence in their analysis.
Reading charts is not about predicting the future — it’s about understanding the story behind price movements. With consistent practice and the use of interactive tools, anyone can turn complex-looking charts into valuable insights for informed and confident investing.
FAQ: How to Read Stock Charts
What is the easiest stock chart for beginners?
Line charts are the easiest for beginners because they show only the closing price and highlight the overall trend without extra details.
Are candlestick charts better than line charts?
Candlestick charts provide more information than line charts, including opening, closing, high, and low prices. They are preferred once beginners become comfortable with basic chart reading.
What timeframe should beginners use when reading stock charts?
Beginners should start with daily or weekly charts. Shorter timeframes can be noisy and lead to emotional decisions.
Do stock charts predict future prices?
No. Stock charts do not predict the future with certainty. They help investors understand trends, momentum, and market behavior to make better-informed decisions.
Why is trading volume important on stock charts?
Volume confirms price movement. High volume supports strong trends, while low volume may indicate weak or temporary price changes.
What indicators should beginners focus on first?
Moving averages, RSI, and MACD are beginner-friendly indicators that help identify trends and momentum without excessive complexity.
Should stock charts be used alone when investing?
No. Stock charts should be combined with fundamental analysis, such as earnings and business performance, for balanced decision-making.
How can tools like Akinda.io help beginners read charts?
Platforms like Akinda.io simplify chart analysis by visualizing trends, indicators, and volume in an easy-to-understand format, helping beginners avoid emotional mistakes.
This article is for educational purposes and reflects widely accepted principles in finance and investment analysis.
Sources & Further Reading
Brown, K. (2020) Stock Market Fundamentals: A Beginner’s Guide. New York: Harper Business.
Clark, T. (2019) Technical Analysis for Modern Investors. Oxford: Oxford University Press.
Foster, A. (2021) Support and Resistance in Financial Markets. London: Routledge.
Harper, D. (2020) Understanding Financial Markets: Principles and Practice. Boston: Pearson.
John, R. (2021) The Basics of Stock Charts and Indicators. Chicago: McGraw Hill.
Johnson, P. (2022) ‘Momentum Indicators and Trend Forecasting’, Global Finance Review, 18(2), pp. 97–110.
Jones, S. (2020) Investing for Beginners: Understanding Stock Charts. Cambridge: Cambridge University Press.
Kumar, V. (2020) Applied Technical Analysis in Equity Markets. Singapore: Springer.
Marketfeed (2023). What are Candlestick Charts? How to Read Them? | marketfeed. [online] Marketfeed.com. Available at: https://www.marketfeed.com/read/en/what-are-candlestick-charts-and-how-to-read-them [Accessed 9 Oct. 2025].
Miller, D. (2019) ‘The Role of Visualization in Market Analysis’, Financial Research Letters, 12(1), pp. 55–67.
Singh, R. (2021) Market Volume and Investor Sentiment. Delhi: Sage Publications.
Smith, E. (2021) Avoiding Common Investor Mistakes. London: Palgrave Macmillan.
Thomas, B. (2022) Reading Bar Charts: Modern Investment Tools. New York: Wiley.
Williams, H. (2021) Stock Trends Explained. Oxford: Routledge.
Yoshida, M. (2020) Candlestick Trading Techniques. Tokyo: Nikkei Press.